


State Senate District 24, Michigan
About
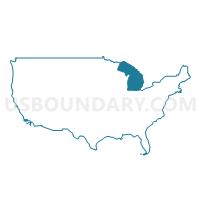
Outline

Summary
| Unique Area Identifier | 200621 |
| Name | State Senate District 24 |
| State | Michigan |
| Area (square miles) | 2,989.76 |
| Land Area (square miles) | 1,953.50 |
| Water Area (square miles) | 1,036.27 |
| % of Land Area | 65.34 |
| % of Water Area | 34.66 |
| Latitude of the Internal Point | 42.59840300 |
| Longtitude of the Internal Point | -85.81121380 |
| Total Population | 278,340 |
| Total Housing Units | 123,486 |
| Total Households | 108,063 |
| Median Age | 40 |
Maps

Graphs
Select a template below for downloading or customizing gragh for State Senate District 24, Michigan


Neighbors
Neighoring State Legislative District Upper Chamber (by Name) Neighboring State Legislative District Upper Chamber on the Map
- State Senate District 19, MI
- State Senate District 20, MI
- State Senate District 21, MI
- State Senate District 21, WI
- State Senate District 22, WI
- State Senate District 23, MI
- State Senate District 28, MI
- State Senate District 30, MI
- State Senate District 33, MI
- State Senate Districts not defined, IL
Top 10 Neighboring County (by Population) Neighboring County on the Map
- Lake County, IL (703,462)
- Kent County, MI (602,622)
- Ingham County, MI (280,895)
- Ottawa County, MI (263,801)
- Kalamazoo County, MI (250,331)
- Racine County, WI (195,408)
- Kenosha County, WI (166,426)
- Jackson County, MI (160,248)
- Calhoun County, MI (136,146)
- Allegan County, MI (111,408)
Top 10 Neighboring County Subdivision (by Population) Neighboring County Subdivision on the Map
- Lansing city, Ingham County, MI (109,563)
- Holland charter township, Ottawa County, MI (35,636)
- Delta charter township, Eaton County, MI (32,408)
- Holland city, Ottawa County, MI (26,035)
- Delhi charter township, Ingham County, MI (25,877)
- Gaines charter township, Kent County, MI (25,146)
- Byron township, Kent County, MI (20,317)
- Park township, Ottawa County, MI (17,802)
- DeWitt charter township, Clinton County, MI (14,321)
- Caledonia township, Kent County, MI (12,332)
Top 10 Neighboring Place (by Population) Neighboring Place on the Map
- Lansing city, MI (114,297)
- Holland city, MI (33,051)
- Holt CDP, MI (23,973)
- Waverly CDP, MI (23,925)
- Charlotte city, MI (9,074)
- Grand Ledge city, MI (7,786)
- Hastings city, MI (7,350)
- Eaton Rapids city, MI (5,214)
- Allegan city, MI (4,998)
- South Haven city, MI (4,403)
Top 10 Neighboring Elementary School District (by Population) Neighboring Elementary School District on the Map
Top 10 Neighboring Unified School District (by Population) Neighboring Unified School District on the Map
- Lansing Public School District, MI (122,593)
- Hudsonville Public School District, MI (37,248)
- Holland City School District, MI (36,507)
- Grand Ledge Public Schools, MI (34,246)
- Zeeland Public Schools, MI (30,843)
- Holt Public Schools, MI (28,051)
- Byron Center Public Schools, MI (21,796)
- Caledonia Community Schools, MI (21,389)
- Waverly Community Schools, MI (20,625)
- Hastings Area School District, MI (19,432)
Top 10 Neighboring State Legislative District Lower Chamber (by Population) Neighboring State Legislative District Lower Chamber on the Map
- State House District 61, MI (103,705)
- State House District 72, MI (103,319)
- State House District 67, MI (100,145)
- State House District 88, MI (99,795)
- State House District 86, MI (99,294)
- State House District 93, MI (98,165)
- State House District 71, MI (97,665)
- State House District 90, MI (97,061)
- State House District 87, MI (96,428)
- State House District 89, MI (96,358)
Top 10 Neighboring 111th Congressional District (by Population) Neighboring 111th Congressional District on the Map
- Congressional District 8, MI (707,572)
- Congressional District 2, MI (698,831)
- Congressional District 3, MI (694,695)
- Congressional District 7, MI (676,899)
- Congressional District 6, MI (671,883)
Top 10 Neighboring Census Tract (by Population) Neighboring Census Tract on the Map
- Census Tract 146.02, Kent County, MI (9,513)
- Census Tract 313, Ionia County, MI (8,098)
- Census Tract 103, Barry County, MI (7,884)
- Census Tract 113, Barry County, MI (7,877)
- Census Tract 27, Kalamazoo County, MI (7,600)
- Census Tract 304.01, Allegan County, MI (7,439)
- Census Tract 303, Allegan County, MI (7,290)
- Census Tract 305, Allegan County, MI (7,281)
- Census Tract 148.07, Kent County, MI (6,964)
- Census Tract 101, Van Buren County, MI (6,881)
Top 10 Neighboring 5-Digit ZIP Code Tabulation Area (by Population) Neighboring 5-Digit ZIP Code Tabulation Area on the Map
- 49423, MI (44,977)
- 48911, MI (40,111)
- 49426, MI (33,244)
- 48917, MI (32,062)
- 49464, MI (27,481)
- 48906, MI (26,634)
- 49014, MI (22,127)
- 48813, MI (21,182)
- 49017, MI (20,785)
- 48842, MI (20,432)
Data
Demographic, Population, Households, and Housing Units
** Data sources from census 2010 **
Show Data on Map
Download Full List as CSV
Download Quick Sheet as CSV
| Subject | This Area | Michigan | National |
|---|---|---|---|
| POPULATION | |||
| Total Population Map | 278,340 | 9,883,640 | 308,745,538 |
| POPULATION, HISPANIC OR LATINO ORIGIN | |||
| Not Hispanic or Latino Map | 264,449 | 9,447,282 | 258,267,944 |
| Hispanic or Latino Map | 13,891 | 436,358 | 50,477,594 |
| POPULATION, RACE | |||
| White alone Map | 255,424 | 7,803,120 | 223,553,265 |
| Black or African American alone Map | 8,388 | 1,400,362 | 38,929,319 |
| American Indian and Alaska Native alone Map | 1,374 | 62,007 | 2,932,248 |
| Asian alone Map | 2,676 | 238,199 | 14,674,252 |
| Native Hawaiian and Other Pacific Islander alone Map | 46 | 2,604 | 540,013 |
| Some Other Race alone Map | 4,748 | 147,029 | 19,107,368 |
| Two or More Races Map | 5,684 | 230,319 | 9,009,073 |
| POPULATION, SEX | |||
| Male Map | 137,773 | 4,848,114 | 151,781,326 |
| Female Map | 140,567 | 5,035,526 | 156,964,212 |
| POPULATION, AGE (18 YEARS) | |||
| 18 years and over Map | 209,557 | 7,539,572 | 234,564,071 |
| Under 18 years | 68,783 | 2,344,068 | 74,181,467 |
| POPULATION, AGE | |||
| Under 5 years | 17,175 | 596,286 | 20,201,362 |
| 5 to 9 years | 18,656 | 637,784 | 20,348,657 |
| 10 to 14 years | 20,245 | 675,216 | 20,677,194 |
| 15 to 17 years | 12,707 | 434,782 | 12,954,254 |
| 18 and 19 years | 7,413 | 304,817 | 9,086,089 |
| 20 years | 3,279 | 149,350 | 4,519,129 |
| 21 years | 2,961 | 138,484 | 4,354,294 |
| 22 to 24 years | 9,185 | 381,238 | 12,712,576 |
| 25 to 29 years | 15,377 | 589,583 | 21,101,849 |
| 30 to 34 years | 15,466 | 574,566 | 19,962,099 |
| 35 to 39 years | 16,707 | 612,493 | 20,179,642 |
| 40 to 44 years | 18,710 | 665,481 | 20,890,964 |
| 45 to 49 years | 22,216 | 744,581 | 22,708,591 |
| 50 to 54 years | 22,872 | 765,452 | 22,298,125 |
| 55 to 59 years | 20,172 | 683,186 | 19,664,805 |
| 60 and 61 years | 7,298 | 243,067 | 7,113,727 |
| 62 to 64 years | 9,744 | 325,744 | 9,704,197 |
| 65 and 66 years | 5,428 | 177,313 | 5,319,902 |
| 67 to 69 years | 7,218 | 241,312 | 7,115,361 |
| 70 to 74 years | 8,892 | 306,084 | 9,278,166 |
| 75 to 79 years | 6,610 | 244,085 | 7,317,795 |
| 80 to 84 years | 5,222 | 200,855 | 5,743,327 |
| 85 years and over | 4,787 | 191,881 | 5,493,433 |
| MEDIAN AGE BY SEX | |||
| Both sexes Map | 40.00 | 38.90 | 37.20 |
| Male Map | 39.10 | 37.60 | 35.80 |
| Female Map | 40.90 | 40.00 | 38.50 |
| HOUSEHOLDS | |||
| Total Households Map | 108,063 | 3,872,508 | 116,716,292 |
| HOUSEHOLDS, HOUSEHOLD TYPE | |||
| Family households: Map | 76,262 | 2,554,073 | 77,538,296 |
| Husband-wife family Map | 60,497 | 1,857,127 | 56,510,377 |
| Other family: Map | 15,765 | 696,946 | 21,027,919 |
| Male householder, no wife present Map | 4,846 | 185,363 | 5,777,570 |
| Female householder, no husband present Map | 10,919 | 511,583 | 15,250,349 |
| Nonfamily households: Map | 31,801 | 1,318,435 | 39,177,996 |
| Householder living alone Map | 26,130 | 1,079,678 | 31,204,909 |
| Householder not living alone Map | 5,671 | 238,757 | 7,973,087 |
| HOUSEHOLDS, HISPANIC OR LATINO ORIGIN OF HOUSEHOLDER | |||
| Not Hispanic or Latino householder: Map | 104,488 | 3,757,825 | 103,254,926 |
| Hispanic or Latino householder: Map | 3,575 | 114,683 | 13,461,366 |
| HOUSEHOLDS, RACE OF HOUSEHOLDER | |||
| Householder who is White alone | 100,980 | 3,158,462 | 89,754,352 |
| Householder who is Black or African American alone | 3,294 | 523,980 | 14,129,983 |
| Householder who is American Indian and Alaska Native alone | 508 | 22,676 | 939,707 |
| Householder who is Asian alone | 708 | 74,263 | 4,632,164 |
| Householder who is Native Hawaiian and Other Pacific Islander alone | 11 | 860 | 143,932 |
| Householder who is Some Other Race alone | 1,347 | 39,917 | 4,916,427 |
| Householder who is Two or More Races | 1,215 | 52,350 | 2,199,727 |
| HOUSEHOLDS, HOUSEHOLD TYPE BY HOUSEHOLD SIZE | |||
| Family households: Map | 76,262 | 2,554,073 | 77,538,296 |
| 2-person household Map | 34,874 | 1,116,122 | 31,882,616 |
| 3-person household Map | 16,181 | 575,906 | 17,765,829 |
| 4-person household Map | 14,298 | 490,745 | 15,214,075 |
| 5-person household Map | 6,908 | 230,373 | 7,411,997 |
| 6-person household Map | 2,591 | 87,344 | 3,026,278 |
| 7-or-more-person household Map | 1,410 | 53,583 | 2,237,501 |
| Nonfamily households: Map | 31,801 | 1,318,435 | 39,177,996 |
| 1-person household Map | 26,130 | 1,079,678 | 31,204,909 |
| 2-person household Map | 4,850 | 191,327 | 6,360,012 |
| 3-person household Map | 518 | 27,576 | 992,156 |
| 4-person household Map | 188 | 13,570 | 411,171 |
| 5-person household Map | 70 | 3,701 | 126,634 |
| 6-person household Map | 29 | 1,628 | 48,421 |
| 7-or-more-person household Map | 16 | 955 | 34,693 |
| HOUSING UNITS | |||
| Total Housing Units Map | 123,486 | 4,532,233 | 131,704,730 |
| HOUSING UNITS, OCCUPANCY STATUS | |||
| Occupied Map | 108,063 | 3,872,508 | 116,716,292 |
| Vacant Map | 15,423 | 659,725 | 14,988,438 |
| HOUSING UNITS, OCCUPIED, TENURE | |||
| Owned with a mortgage or a loan Map | 58,950 | 1,920,245 | 52,979,430 |
| Owned free and clear Map | 25,576 | 873,097 | 23,006,644 |
| Renter occupied Map | 23,537 | 1,079,166 | 40,730,218 |
| HOUSING UNITS, VACANT, VACANCY STATUS | |||
| For rent Map | 2,624 | 141,687 | 4,137,567 |
| Rented, not occupied Map | 138 | 6,684 | 206,825 |
| For sale only Map | 2,203 | 77,080 | 1,896,796 |
| Sold, not occupied Map | 469 | 17,978 | 421,032 |
| For seasonal, recreational, or occasional use Map | 6,927 | 263,071 | 4,649,298 |
| For migrant workers Map | 77 | 1,773 | 24,161 |
| Other vacant Map | 2,985 | 151,452 | 3,652,759 |
| HOUSING UNITS, OCCUPIED, AVERAGE HOUSEHOLD SIZE BY TENURE | |||
| Total: Map | 2.55 | 2.49 | 2.58 |
| Owner occupied Map | 2.62 | 2.57 | 2.65 |
| Renter occupied Map | 2.28 | 2.29 | 2.44 |
| HOUSING UNITS, OCCUPIED, TENURE BY RACE OF HOUSEHOLDER | |||
| Owner occupied: Map | 84,526 | 2,793,342 | 75,986,074 |
| Householder who is White alone Map | 80,936 | 2,452,233 | 63,446,275 |
| Householder who is Black or African American alone Map | 1,363 | 235,381 | 6,261,464 |
| Householder who is American Indian and Alaska Native alone Map | 332 | 13,611 | 509,588 |
| Householder who is Asian alone Map | 394 | 43,419 | 2,688,861 |
| Householder who is Native Hawaiian and Other Pacific Islander alone Map | 6 | 466 | 61,911 |
| Householder who is Some Other Race alone Map | 785 | 20,361 | 1,975,817 |
| Householder who is Two or More Races Map | 710 | 27,871 | 1,042,158 |
| Renter occupied: Map | 23,537 | 1,079,166 | 40,730,218 |
| Householder who is White alone Map | 20,044 | 706,229 | 26,308,077 |
| Householder who is Black or African American alone Map | 1,931 | 288,599 | 7,868,519 |
| Householder who is American Indian and Alaska Native alone Map | 176 | 9,065 | 430,119 |
| Householder who is Asian alone Map | 314 | 30,844 | 1,943,303 |
| Householder who is Native Hawaiian and Other Pacific Islander alone Map | 5 | 394 | 82,021 |
| Householder who is Some Other Race alone Map | 562 | 19,556 | 2,940,610 |
| Householder who is Two or More Races Map | 505 | 24,479 | 1,157,569 |
| HOUSING UNITS, OCCUPIED, TENURE BY HISPANIC OR LATINO ORIGIN OF HOUSEHOLDER | |||
| Owner occupied: Map | 84,526 | 2,793,342 | 75,986,074 |
| Not Hispanic or Latino householder Map | 82,414 | 2,728,916 | 69,617,625 |
| Hispanic or Latino householder Map | 2,112 | 64,426 | 6,368,449 |
| Renter occupied: Map | 23,537 | 1,079,166 | 40,730,218 |
| Not Hispanic or Latino householder Map | 22,074 | 1,028,909 | 33,637,301 |
| Hispanic or Latino householder Map | 1,463 | 50,257 | 7,092,917 |
| HOUSING UNITS, OCCUPIED, TENURE BY HOUSEHOLD SIZE | |||
| Owner occupied: Map | 84,526 | 2,793,342 | 75,986,074 |
| 1-person household Map | 16,809 | 643,556 | 16,453,569 |
| 2-person household Map | 33,468 | 1,031,004 | 27,618,605 |
| 3-person household Map | 13,293 | 446,449 | 12,517,563 |
| 4-person household Map | 12,013 | 392,843 | 10,998,793 |
| 5-person household Map | 5,697 | 177,918 | 5,057,765 |
| 6-person household Map | 2,113 | 64,470 | 1,965,796 |
| 7-or-more-person household Map | 1,133 | 37,102 | 1,373,983 |
| Renter occupied: Map | 23,537 | 1,079,166 | 40,730,218 |
| 1-person household Map | 9,321 | 436,122 | 14,751,340 |
| 2-person household Map | 6,256 | 276,445 | 10,624,023 |
| 3-person household Map | 3,406 | 157,033 | 6,240,422 |
| 4-person household Map | 2,473 | 111,472 | 4,626,453 |
| 5-person household Map | 1,281 | 56,156 | 2,480,866 |
| 6-person household Map | 507 | 24,502 | 1,108,903 |
| 7-or-more-person household Map | 293 | 17,436 | 898,211 |
Loading...